
Blog
First experiences with a UU-developed Learning Analytics platform
The UU team participating in the USO-project on ‘Differentiation Using Blended Learning and Learning Analytics’(DUBLLA) has been working on different subprojects aiming at implementing different forms of Learning Analytics in their courses.
One of the ambitions at UU is that by 2020 students will have more opportunities to personalise their studies (see strategic plan). An important role in this process is given to computer-based technology that has already become a reality in every aspect and every context of modern education fostering interaction, facilitating assessment and connecting students and teachers. As more and more tools are being used in real classrooms to support various educational activities, more and more data is generated as a result of these activities. Not only this data is big in size, it is also diverse and enriched with metadata – carrying information about students, classes, learning objects, grades, etc.
The role of Learning Analytics. When this data is processed, aggregated and visualized it can provide an invaluable source of insights into the learning experiences of individual students, classes and even entire universities, helping stakeholders ask important questions and detect critical events that might otherwise go unnoticed. Teachers can, for instance, see to what degree students master specific concepts, which misconceptions they have and adapt their teaching based on this information. Students might monitor their own progress, see how well they do in relation to their peers and ask for more information or support if needed.
LearnLytics platform. The number of e-learning systems used at a university, the diversity of educational contexts, the number of potential users (both students and teachers) are among the factors that contribute to the success or failure of a learning analytics platform. At UU, all these factors have been growing rapidly, thus increasing the demands for such a tool and mandating that a successful design of a learning analytics platform should be maximally open and inclusive. This guiding principle has been implemented in the LearnLytics platform which is the main technical product of the DUBLLA project. It is built around an xAPI-compatable learning record store that can accept events from any educational system and integrates a battery of analytic services computing customizable reports and visualizations for teachers and students.
As a proof-of-concept, the assessment system Remindo has been connected to LearnLytics. It is possible now to retrieve, aggregate, display and analyse Remindo data in LearnLytics. A teacher can associate Remindo tests and questions with target concepts and misconceptions, thus allowing the LearnLytics platform to assess students strengths and weaknesses in a meaningful way. The system computes and updates students’ profiles that can be visualised in individual or aggregated form. Thus a teacher can observe detailed students’ progress in terms of concepts and misconceptions and focus on what still needs to be addressed in class. A student, in her turn, can browse through her own assessment data and compare it with the aggregated data of her cohort or the entire course, thus receiving formative assessment experience and getting a chance to remedy individual learning difficulties.
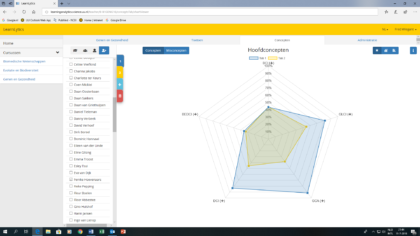
Figure 1: A specific student (in blue) performs better on three main concepts in comparison with the mean of the group of 80 peers (in yellow), but as well as the average on two other concepts.
The Biology Use Case using LearnLytics. In this project, a set of concept inventories were used as formative tests in three different courses. Concept inventories are validated sets of multiple choice questions providing detailed insight in how well students master different aspects of crucial concepts as well as whether they may hold specific misconceptions.
Students in two evolution courses did formative tests in Remindo during the first three weeks of the course in period 1 (Evolutie & Biodiversiteit, n=270) and in period 3 (Evolutiebiologie, n=28). These tests were focused on important concepts in evolution, such as natural selection, genetic drift and speciation. In addition, formative tests focused on different aspects of genetics were offered in the course ‘Genen en Gezondheid’ (period 4, n=80) (see illustrations for a short impression of results).
For the teacher, the LearningLytics platform provide useful information on how well students perform at the beginning of the course, which aspects of specific concepts are most problematic and whether there are questions that require an explanation in more depth during class sessions. The teacher can also observe how well individual students perform as compared with the group average or compare the performance of individual students. Furthermore, the presence of specific misconceptions is diagnosed. Following diagnosis of concept knowledge & misconceptions, remediation is then a logical next step, which will be the focus of a follow-up project.
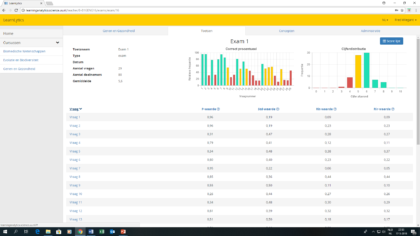
Figure 2: An indication of how well students (n=80) performed on the individual questions of the BCI (Biological Concepts Instrument). Results of individual questions (middle, upper part) in green were answered correctly by more than 60% of students, in yellow are the questions that were answered well by 50- 60% of the students and in red the questions that were answered well by less than 50% of the students. At the top right the frequency distribution is shown if students would have been graded for their performance. In the lower part of the illustration, the statistical characteristics (p-value, Std, Rit- and Rir-value) are shown for each individual question.
Focus group with students. Students experienced these formative tests as beneficial. In a focus group meeting (with 10 students) after their first exam in week 5 in period 4, they indicated to like the following aspects of being able to visualize their results in LearnLytics:
-the fact that test questions were connected to their understanding of basic concepts.
-that they obtained an overview in which the different formative tests were combined in histograms or spider webs.
-the comparison of their own performance with their peers, although it should be noted that this was especially reported by those students that performed better than their peers.
-the overall visual presentation of the data. In this respect, they indicated that the diagrams were very clear and helpful.
In addition, it should be mentioned that they didn’t encounter any technical problems, that they thought that the display invited to try a number of different options in which the data can be visualized (spider web, histograms). They also mentioned that they would like to have LearnLytics in other courses as well, for instance also focusing on more specific or advanced concept knowledge.
The future of LA at UU. Learning Analytics is one of the few educational technologies that promise to become mainstream in the near future. UU has substantial plans to further develop LA initiatives.
One of such initiatives is the launch of the Special Interest Group (SIG) on Learning Analytics within the Utrecht Applied Data Science focus area. The role of this SIG is to coordinate, consolidate and disseminate efforts of UU academic community in the field of LA. More information about it can be found here
The new USO project THERMOS: TeacHERs MOnitoring their Students is another effort to leverage educational data for supporting students in optimizing their learning experience. More information about the project can be found here.
The last but not the least, the development of LearnLytics platform itself will continue. In a follow-up project, the focus will be made on the link between the diagnostic phase and the remedial phase. Based on specific omissions in knowledge or a misconception a student may have, personalised study material can be offered within the LearnLytics platform. The USO-project “Towards personalised education” will focus on shaping the online remediation steps.
For more information about the USO project Differentiation using Blended Learning and Learning Analytics you can contact Harold van Rijen (H.V.M.vanRijen@umcutrecht.nl)
For more information about the Learning Analytics Platform or if are interested in using LearnLytics in your own course you can contact Sergey Sosnovsky (s.a.sosnovsky@uu.nl)
For more information about the use case on the course Evolution & Biodiversity (BIO), Evolutiebiologie (BMW) and Genen & Gezondheid (BIO) or the follow-up USO project Towards personalized education you can contact Fred Wiegant (F.A.C.Wiegant@uu.nl)
*Figures: Illustrations (Printscreens) of some results obtained in the course Genen & Gezondheid (Biology, periode 4, 2017-2018; n=80). Concept inventories on different aspects in the field of Genetics were offered as formative tests in Remindo. Data were linked to the LearnLytics platform in order to visualize results in different ways. Figures 1 and 2 give some impressions.
 19 juli 2018
U moet ingelogd zijn om te reageren, gebruik het formulier aan de linkerkant om in te loggen met uw solis gegevens.